Market Outlook
November 23, 2016
Market Cues
Domestic Indices
Chg (%)
(Pts)
(Close)
Indian market is expected to open on a positive note tracking the SGX Nifty.
BSE Sensex
0.8
196
25,961
The US markets, continued their gains on Tuesday as investor optimism over the
Nifty
0.9
73
8,002
outlook under President Trump lifted stocks. Existing home sales climbed to their
Mid Cap
1.4
163
11,898
highest in nearly a decade for the month of October. Existing home sales increased
Small Cap
1.2
133
11,627
by 2.0 % to an annual rate of 5.6 mln in October after jumping by 3.6 % to a
Bankex
0.7
138
21,236
revised 5.49 mln in September. Steel stocks also rallied sharply after Trump’s pledge
to pull out of the Trans-Pacific Partnership on his first day in office.
Global Indices
Chg (%)
(Pts)
(Close)
FTSE
100 extended its gains from the Tuesday session on strengthening in
Dow Jones
0.4
67
19,024
commodity prices. Mining and energy stocks rallied in response to higher underlying
commodity prices. Miners Anglo American, Antofagasta, BHP Billiton, Glencore and
Nasdaq
0.3
17
5,386
Rio Tinto climbed between 3 to 5 percent as a weaker dollar drove copper and iron
FTSE
0.6
42
6,820
ore prices higher. Energy major Tullow Oil soared 4 percent, Royal Dutch Shell rose
Nikkei
0.3
57
18,163
over 1 percent and BP Plc advanced 1.5 percent as oil prices extended overnight
Hang Seng
1.4
320
22,678
gains on speculation that OPEC members will be able to sign a production freeze
Shanghai Com
0.9
30
3,248
deal at next week's meeting.
Indian markets rebounded from their six month lows and covered some of the losses
Advances / Declines
BSE
NSE
of previous sessions. UltraTech, Maruti Suzuki, Bajaj Auto, Zee Entertainment
Enterprises and Hindalco were the gainers for the session climbing between 3-6
Advances
1,444
990
percent. Capital goods manufacturers such as BHEL and Larsen & Toubro were
Declines
1,133
629
losers for the session and dropped between 2-3 percent each.
Unchanged
187
69
News Analysis
Volumes (` Cr)
L&T net profit up by 84% in Q2FY17
BSE
2,307
Posco, Tata Steel show interest in NMDC Bastar steel plan
Detailed analysis on Pg2
NSE
18,359
Investor’s Ready Reckoner
Net Inflows (` Cr)
Net
Mtd
Ytd
Key Domestic & Global Indicators
FII
(1,241)
(11,088)
33,927
Stock Watch: Latest investment recommendations on 150+ stocks
MFs
920
8,024
30,077
Refer Pg5 onwards
Top Picks
Top Gainers
Price (`)
Chg (%)
CMP
Target
Upside
Company
Sector
Rating
Mrpl
88
8.0
(`)
(`)
(%)
Amara Raja BatteriesAuto & Auto Ancill.
Buy
925
1,167
26.2
Sobha
256
7.7
HCL Tech
IT
Buy
761
1,000
31.4
Indiacem
114
7.4
Asian Granito
Capital Goods
Buy
180
351
95.3
Prestige
158
7.3
Equitas Holdings
Financials
Buy
150
235
57.0
Finolexind
414
6.6
Navkar Corporation Others
Buy
172
265
54.1
More Top Picks on Pg3
Top Losers
Price (`)
Chg (%)
Key Upcoming Events
Rcom
35
(4.0)
Previous
Consensus
Date
Region
Event Description
Reading
Expectations
Irb
182
(3.6)
Nov 23 Germany PMI Services
54.2
54.0
Den
72
(3.5)
Nov 23 Germany PMI Manufacturing
55.0
54.8
Ofss
2,843
(3.4)
Nov 23 US
Initial Jobless claims
235.0
248.0
Gvkpil
5
(3.3)
Nov 23 UK
GDP (YoY)
2.3
2.3
As on November 22, 2016
Nov 24 US
New home sales
593.0
590.0
More Events on Pg4
Market Outlook
November 23, 2016
News Analysis
L&T net profit up by 84% in Q2FY17
Engineering major Larsen & Toubro reporrted an
84% YoY growth in its
consolidated net profit to `1,435 crore in the quarter ended September 30,
against `778 cr. The company said its consolidated order inflow, stood at
`31,119cr during the quarter, registered an increase of 11% YoY. International
orders stood at `7,386 cr, which was 24% of order inflow. On a cumulative basis,
the order inflow for 1H FY17 stood at `60,821cr. Consolidated gross revenue for
the quarter under review was at `25,011cr, an increase 8.2 % from `23,123cr
YoY.
Larsen & Toubro has also recently retrenched 11% of its workforce in attempts to
improve efficiency and lower costs. We currently have a BUY recommendation on
the stock with a target of `1,700.
Posco, Tata Steel show interest in NMDC Bastar steel plan
Leading steel companies across the globe have shown interest in buying the
Nagarnaar steel plant of the National Mineral Development Corporation (NMDC),
which is coming up in Chhattisgarh’s Bastar district.
The sale is part of a government plan to sell earmarked units which are loss
making to strategic buyers. The three-million tonne-per-annum (mtpa) steel plant
is expected to start trial production by mid-2017.
The Nagarnaar project is said to be a viable deal for any party as there would not
be an issues due to land or raw material. The land that the company had
acquired for the state-owned NMDC and the construction work of the plant was in
the final stage. Clearances had even been granted for an iron-ore mine that would
meet the raw material requirement of the plant.
Economic and Political News
RBI doubles balance for prepaid wallets and cards to `20,000
Railway Ministry announces service tax waiver on tickets booked through the
IRCTC website from November 23 to December 31
Under the Indradhanush Plan, Central Government proposes to re-capitalise
PSBs with `70,000cr over four years
Corporate News
Bharti Airtel completes acquisition of 4G airwaves of Aircel in eight telecom
circles in a `3,500cr spectrum trading deal
Britannia Industries forecasts weak Q3 as sales are expected to be hit by 15 to
20% in the next 45 days due to the demonetization
India cements to invest `400cr as capex over next 2 years
Market Outlook
November 23, 2016
Top Picks ★★★★★
Large Cap
Market Cap
CMP
Target
Upside
Company
Rationale
(` Cr)
(`)
(`)
(%)
To outpace battery industry growth due to better technological
Amara Raja Batteries
15,795
925
1,167
26.2
products leading to market share gains in both the
automotive OEM and replacement segments.
The stock is trading at attractive valuations and is factoring all
HCL Tech
1,07,344
761
1,000
31.4
the bad news.
Back on the growth trend; expect a long term growth of 14%
Infosys
2,09,929
914
1,249
36.6
to be a US$20bn in FY2020.
Source: Company, Angel Research
Mid Cap
Market Cap
CMP
Target
Upside
Company
Rationale
(` Cr)
(`)
(`)
(%)
We expect the company would report strong profitability
Asian Granito
541
180
351
95.3
owing to better product mix, higher B2C sales and
amalgamation synergy.
Among the top 4 players in the consumer durables segment.
Bajaj Electricals
2,085
206
274
32.7
Improved profitability backed by turn around in E&P segment.
Strong order book lends earnings visibility.
Favourable outlook for the AC industry to augur well for
Cooling products business which is out pacing the market
Blue Star
4,423
464
634
36.7
growth. EMPPAC division's profitability to improve once
operating environment turns around.
With a focus on the low and medium income (LMI) consumer
Dewan Housing Finance
7,110
227
350
54.1
segment, the company has increased its presence in tier-II &
III cities where the growth opportunity is immense.
Strong loan growth backed by diversified loan portfolio and
Equitas Holdings
5,019
150
235
57.0
adequate CAR. ROE & ROA likely to remain decent as risk of
dilution remains low. Attractive valuations considering growth.
Economic recovery to have favourable impact on advertising
& circulation revenue growth. Further, the acquisition of a
Jagran Prakashan
5,556
170
225
32.4
radio business (Radio City) would also boost the company's
revenue growth.
Speedier execution and speedier sales, strong revenue visibilty
Mahindra Lifespace
1,448
353
522
47.9
in short-to-long run, attractive valuations
We expect the company to report strong growth on back of
healthy growth in domestic branded sales (owing to
Mirza International
845
70
107
52.4
aggressive ad spend and addition in the number of EBOs &
multi-brand outlets [MBOs]) and healthy export revenues.
Massive capacity expansion along with rail advantage at ICD
Navkar Corporation
2,453
172
265
54.1
as well CFS augurs well for the company.
Strong brands and distribution network would boost growth
Siyaram Silk Mills
1,137
1,213
1,714
41.4
going ahead. Stock currently trades at an inexpensive
valuation.
Market leadership in Hindi news genre and no. 2 viewership
ranking in English news genre, exit from the radio business,
TV Today Network
1,797
301
385
27.8
and anticipated growth in ad spends by corporate to benefit
the stock.
Source: Company, Angel Research
Market Outlook
November 23, 2016
Key Upcoming Events
Result Calendar
Date
Company
Nov 23, 2016
Siemens
Nov 24, 2016
Manpasand Bever.
Nov 25, 2016
Tide Water Oil India
Nov 29, 2016
Tata Power Co.
Dec 1, 2016
GSPL
Source: Bloomberg, Angel Research
Global economic events release calendar
Date
Time
Country
Event Description
Unit
Period
Bloomberg Data
Last Reported Estimated
Nov 23, 2016 2:00PM
Germany
PMI Services
Value
Nov P
54.20
54.00
7:00PM
US
Initial Jobless claims
Thousands
Nov 19
235.00
250.00
2:00PM
Germany
PMI Manufacturing
Value
Nov P
55.00
54.80
3:00PM
UK
GDP (YoY)
% Change
3Q P
2.30
2.30
Nov 24, 2016 8:30PM
US
New home sales
Thousands
Oct
593.00
590.00
Nov 25, 2016 12:30PM
Germany
GDP nsa (YoY)
% Change
3Q F
1.50
1.50
Nov 29, 2016 7:00PM
US
GDP Qoq (Annualised)
% Change
3Q S
2.90
3.00
8:30PM
US
Consumer Confidence
S.A./ 1985=100
Nov
98.60
100.00
Nov 30, 2016 2:25PM
Germany
Unemployment change (000's)
Thousands
Nov
(13.00)
--
Dec 1, 2016
3:00PM
UK
PMI Manufacturing
Value
Nov
54.30
--
6:30AM
China
PMI Manufacturing
Value
Nov
51.20
51.00
Dec 2, 2016
7:00PM
US
Change in Nonfarm payrolls
Thousands
Nov
161.00
175.00
7:00PM
US
Unnemployment rate
%
Nov
4.90
4.90
Dec 6, 2016
3:30PM
Euro Zone
Euro-Zone GDP s.a. (QoQ)
% Change
3Q F
0.30
--
Dec 7, 2016
3:00PM
UK
Industrial Production (YoY)
% Change
Oct
0.30
--
2:30PM
India
RBI Repo rate
%
Dec 7
6.25
--
2:30PM
India
RBI Reverse Repo rate
%
Dec 7
5.75
--
2:30PM
India
RBI Cash Reserve ratio
%
Dec 7
4.00
--
Dec 8, 2016
China
Exports YoY%
% Change
Nov
(7.30)
--
6:15PM
Euro Zone
ECB announces interest rates
%
Dec 8
--
--
Dec 9, 2016
India
Imports YoY%
% Change
Nov
8.10
--
India
Exports YoY%
% Change
Nov
9.59
--
7:00AM
China
Consumer Price Index (YoY)
% Change
Nov
2.10
--
Dec 12, 2016 5:30PM
India
Industrial Production YoY
% Change
Oct
0.70
--
Dec 13, 2016 3:00PM
UK
CPI (YoY)
% Change
Nov
0.90
--
3:00PM
UK
Jobless claims change
% Change
Nov
9.80
--
Dec 14, 2016 7:45PM
US
Industrial Production
%
Nov
0.04
--
US
Producer Price Index (mom)
% Change
Nov
0.40
--
7:30AM
China
Industrial Production (YoY)
% Change
Nov
6.10
--
12:00PM
India
Monthly Wholesale Prices YoY%
% Change
Nov
3.39
--
Dec 15, 2016 7:00PM
US
Consumer price index (mom)
% Change
Nov
0.40
--
5:30PM
UK
BOE Announces rates
% Ratio
Dec 15
0.25
--
12:30AM
US
FOMC rate decision
%
Dec 14
0.50
0.75
Source: Bloomberg, Angel Research
Market Outlook
November 23, 2016
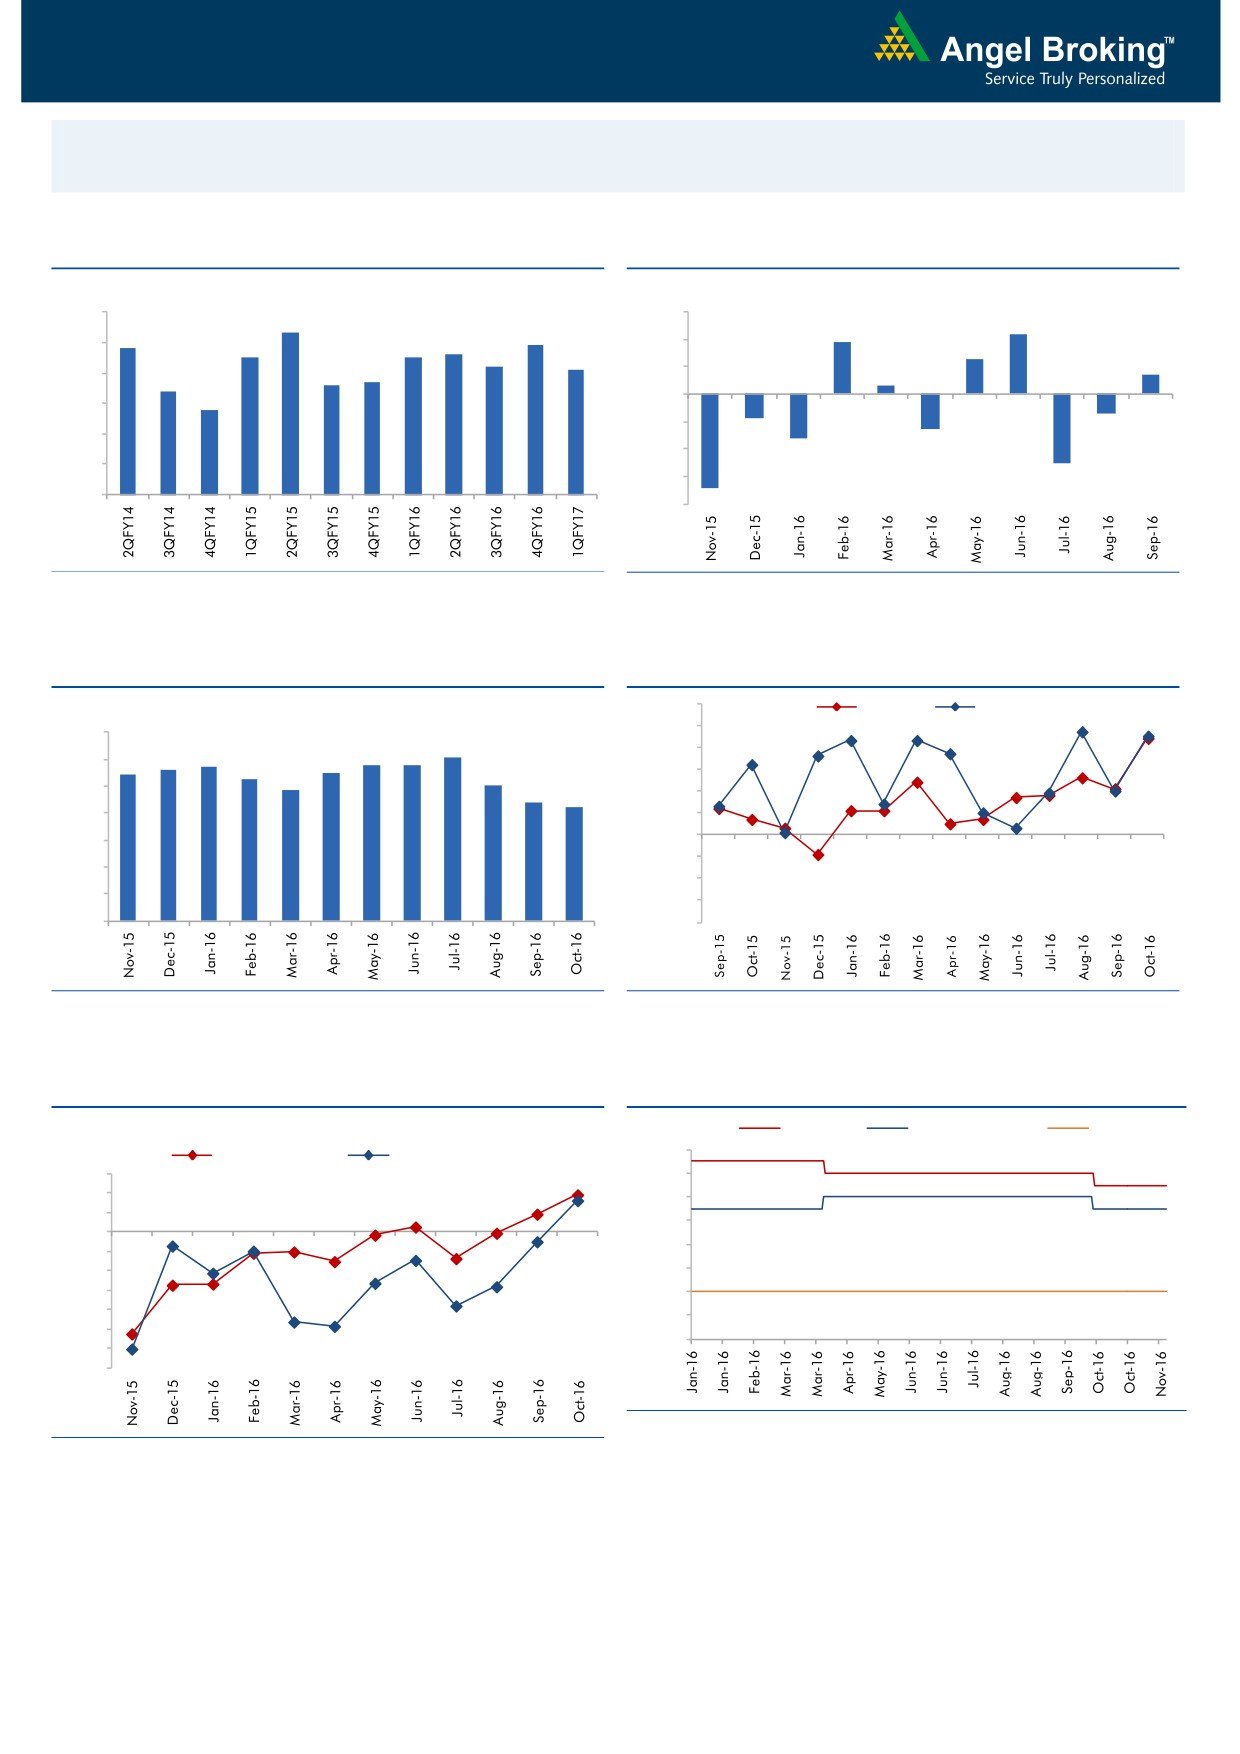
Macro watch
Exhibit 1: Quarterly GDP trends
Exhibit 2: IIP trends
(%)
(%)
9.0
3.0
8.3
2.2
7.9
1.9
7.8
8.0
7.5
7.5
7.6
2.0
1.3
7.2
7.1
0.7
6.6
6.7
1.0
0.3
7.0
6.4
5.8
-
6.0
(1.0)
5.0
(0.9)
(0.7)
(2.0)
(1.3)
(1.6)
4.0
(3.0)
(2.5)
3.0
(4.0)
(3.4)
Source: CSO, Angel Research
Source: MOSPI, Angel Research
Exhibit 3: Monthly CPI inflation trends
Exhibit 4: Manufacturing and services PMI
56.0
Mfg. PMI
Services PMI
(%)
55.0
7.0
6.1
5.7
5.8
5.8
54.0
6.0
5.4
5.6
5.5
5.3
5.1
53.0
4.8
5.0
4.4
4.2
52.0
4.0
51.0
3.0
50.0
49.0
2.0
48.0
1.0
47.0
-
46.0
Source: MOSPI, Angel Research
Source: Market, Angel Research; Note: Level above 50 indicates expansion
Exhibit 5: Exports and imports growth trends
Exhibit 6: Key policy rates
c
(%)
Repo rate
Reverse Repo rate
CRR
7.00
(%)
Exports yoy growth
Imports yoy growth
15.0
6.50
10.0
6.00
5.0
5.50
0.0
5.00
(5.0)
(10.0)
4.50
(15.0)
4.00
(20.0)
3.50
(25.0)
3.00
(30.0)
(35.0)
Source: RBI, Angel Research
Source: Bloomberg, Angel Research
Market Outlook
November 23, 2016
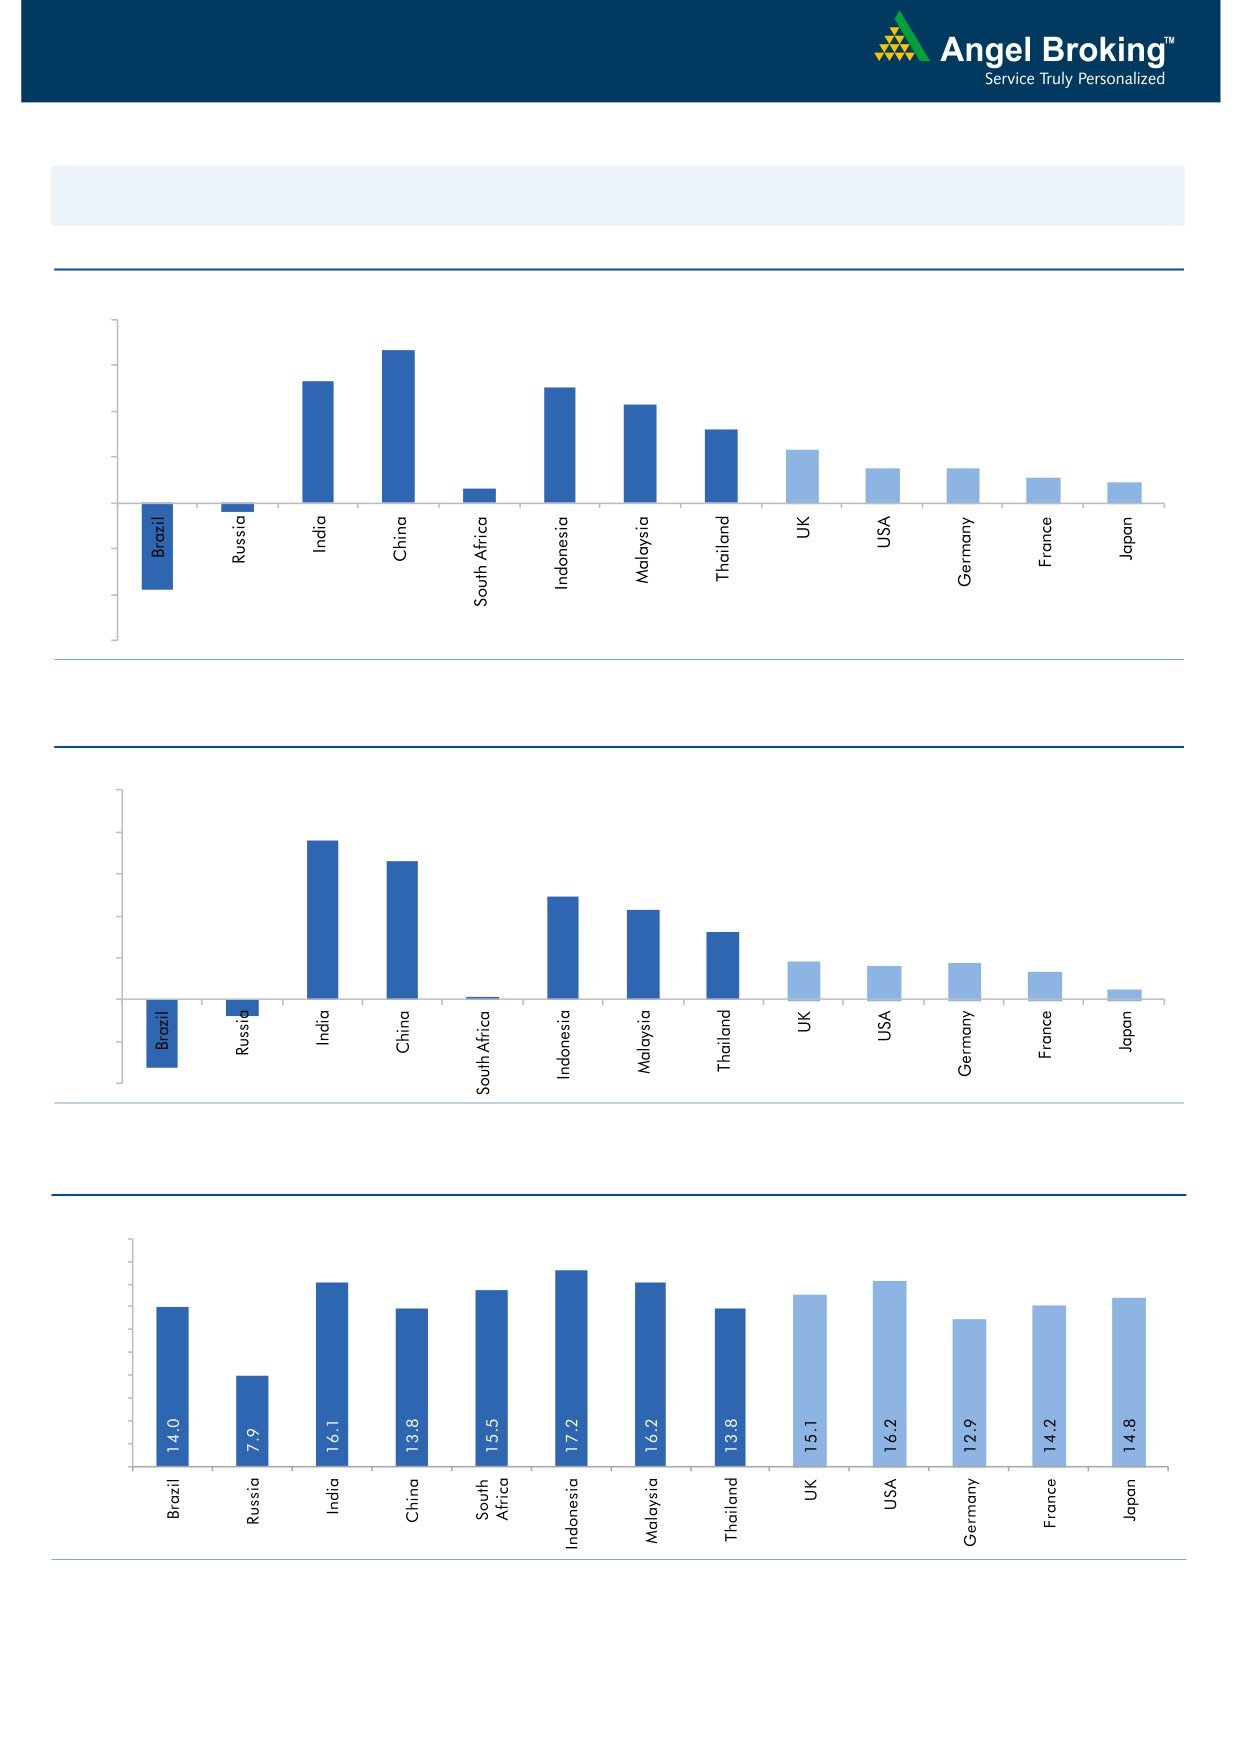
Global watch
Exhibit 1: Latest quarterly GDP Growth (%, yoy) across select developing and developed countries
(%)
8.0
6.7
6.0
5.3
0.6
5.0
4.3
4.0
3.2
2.3
1.5
1.5
2.0
1.1
0.9
-
(2.0)
(0.4)
(4.0)
(3.8)
(6.0)
Source: Bloomberg, Angel Research
Exhibit 2: 2016 GDP Growth projection by IMF (%, yoy) across select developing and developed countries
(%)
10.0
7.6
8.0
6.6
6.0
4.9
4.3
4.0
3.2
1.8
1.7
1.6
1.3
2.0
(0.8)
0.5
(3.3)
0.1
-
(2.0)
(4.0)
Source: IMF, Angel Research
Exhibit 3: One year forward P-E ratio across select developing and developed countries
(x)
20.0
18.0
16.0
14.0
12.0
10.0
8.0
6.0
4.0
2.0
-
Source: IMF, Angel Research
Market Outlook
November 23, 2016
Exhibit 4: Relative performance of indices across globe
Returns (%)
Country
Name of index
Closing price
1M
3M
1YR
Brazil
Bovespa
61,954
(2.4)
4.7
32.2
Russia
Micex
2,066
5.6
3.9
13.1
India
Nifty
8,002
(8.0)
(7.2)
3.1
China
Shanghai Composite
3,248
4.2
4.8
(9.0)
South Africa
Top 40
44,575
(1.1)
(4.9)
(5.1)
Mexico
Mexbol
44,869
(7.5)
(7.1)
0.7
Indonesia
LQ45
871
(6.7)
(6.6)
13.7
Malaysia
KLCI
1,629
(2.4)
(3.9)
(1.6)
Thailand
SET 50
925
(2.0)
(5.7)
3.5
USA
Dow Jones
19,024
4.8
2.6
6.8
UK
FTSE
6,820
(2.9)
(0.7)
7.6
Japan
Nikkei
18,163
5.4
10.2
(7.8)
Germany
DAX
10,714
0.0
1.1
(4.1)
France
CAC
4,548
0.3
2.5
(7.5)
Source: Bloomberg, Angel Research
Stock Watch
November 23, 2016
Company Name
Reco
CMP
Target
Mkt Cap
Sales ( Čcr )
OPM(%)
EPS (Č)
PER(x)
P/BV(x)
RoE(%)
EV/Sales(x)
(Č)
Price ( Č)
( Č cr )
FY17E FY18E
FY17E
FY18E
FY17E
FY18E
FY17E
FY18E
FY17E
FY18E
FY17E
FY18E
FY17E
FY18E
Agri / Agri Chemical
Rallis
Accumulate
187
209
3,627
1,937
2,164
13.3
14.3
9.0
11.0
20.7
17.0
3.6
3.2
18.4
19.8
1.9
1.7
United Phosphorus
Accumulate
607
684
30,752
15,176
17,604
18.5
18.5
37.4
44.6
16.2
13.6
3.2
2.6
21.4
21.2
2.1
1.8
Auto & Auto Ancillary
Ashok Leyland
Buy
76
111
21,558
22,407
26,022
10.6
10.6
5.2
6.4
14.5
11.8
3.3
2.8
23.6
24.7
1.0
0.9
Bajaj Auto
Neutral
2,601
-
75,253
25,093
27,891
19.5
19.2
143.9
162.5
18.1
16.0
5.1
4.4
30.3
29.4
2.7
2.4
Bharat Forge
Neutral
876
-
20,400
7,726
8,713
20.5
21.2
35.3
42.7
24.8
20.5
4.6
4.1
18.9
20.1
2.7
2.3
Eicher Motors
Neutral
20,653
-
56,096
16,583
20,447
17.5
18.0
598.0
745.2
34.5
27.7
11.8
9.0
41.2
38.3
3.2
2.5
Gabriel India
Buy
103
130
1,485
1,544
1,715
9.0
9.3
5.4
6.3
19.2
16.4
3.6
3.2
18.9
19.5
0.9
0.8
Hero Motocorp
Buy
2,997
3,541
59,846
30,958
34,139
15.7
15.7
193.6
208.3
15.5
14.4
6.1
5.0
34.2
30.5
1.8
1.6
Jamna Auto Industries Neutral
175
-
1,395
1,486
1,620
9.8
9.9
15.0
17.2
11.7
10.2
2.6
2.2
21.8
21.3
1.0
0.9
L G Balakrishnan & Bros Neutral
555
-
871
1,302
1,432
11.6
11.9
43.7
53.0
12.7
10.5
1.8
1.6
13.8
14.2
0.8
0.7
Mahindra and Mahindra Neutral
1,218
-
75,640
46,534
53,077
11.6
11.7
67.3
78.1
18.1
15.6
2.9
2.6
15.4
15.8
1.6
1.4
Maruti
Buy
4,931
6,006
148,941
68,057
82,958
15.8
15.5
212.1
261.2
23.3
18.9
4.6
3.8
19.8
20.3
1.9
1.5
Minda Industries
Neutral
265
-
2,103
2,728
3,042
9.0
9.1
68.2
86.2
3.9
3.1
0.9
0.7
23.8
24.3
0.8
0.7
Motherson Sumi
Neutral
285
-
40,018
45,896
53,687
7.8
8.3
13.0
16.1
21.9
17.7
7.1
5.6
34.7
35.4
0.9
0.8
Rane Brake Lining
Neutral
770
-
609
511
562
11.3
11.5
28.1
30.9
27.4
24.9
4.2
3.8
15.3
15.0
1.3
1.2
Setco Automotive
Neutral
36
-
485
741
837
13.0
13.0
15.2
17.0
2.4
2.1
0.4
0.4
15.8
16.3
1.0
0.9
Tata Motors
Neutral
465
-
134,226
300,209
338,549
8.9
8.4
42.7
54.3
10.9
8.6
1.8
1.5
15.6
17.2
0.6
0.5
TVS Motor
Neutral
349
-
16,592
13,390
15,948
6.9
7.1
12.8
16.5
27.4
21.1
6.8
5.4
26.3
27.2
1.3
1.1
Amara Raja Batteries
Buy
925
1,167
15,795
5,504
6,605
18.4
19.8
33.4
40.9
27.7
22.6
6.1
5.0
22.1
22.0
2.9
2.4
Exide Industries
Neutral
174
-
14,828
7,439
8,307
15.0
15.0
8.1
9.3
21.5
18.8
3.0
2.7
14.3
16.7
1.6
1.4
Apollo Tyres
Buy
184
235
9,348
12,877
14,504
14.3
13.9
21.4
23.0
8.6
8.0
1.3
1.2
16.4
15.2
0.9
0.8
Ceat
Buy
1,150
1,450
4,651
7,524
8,624
13.0
12.7
131.1
144.3
8.8
8.0
1.6
1.4
19.8
18.6
0.7
0.6
JK Tyres
Neutral
111
-
2,509
7,455
8,056
15.0
15.0
21.8
24.5
5.1
4.5
1.1
0.9
22.8
21.3
0.5
0.4
Swaraj Engines
Neutral
1,315
-
1,633
660
810
15.2
16.4
54.5
72.8
24.1
18.1
7.5
6.8
31.5
39.2
2.3
1.8
Subros
Neutral
139
-
834
1,488
1,681
11.7
11.9
6.4
7.2
21.7
19.4
2.3
2.1
10.8
11.4
0.8
0.7
Indag Rubber
Neutral
172
-
451
286
326
19.8
16.8
11.7
13.3
14.7
12.9
2.5
2.3
17.8
17.1
1.2
1.1
Capital Goods
ACE
Neutral
44
-
435
709
814
4.1
4.6
1.4
2.1
31.4
21.0
1.3
1.2
4.4
6.0
0.8
0.7
BEML
Neutral
785
-
3,267
3,451
4,055
6.3
9.2
31.4
57.9
25.0
13.6
1.5
1.4
6.3
10.9
1.1
0.9
Bharat Electronics
Accumulate
1,300
1,414
29,042
8,137
9,169
16.8
17.2
58.7
62.5
22.2
20.8
3.4
3.1
44.6
46.3
2.5
2.3
Stock Watch
November 23, 2016
Company Name
Reco
CMP
Target
Mkt Cap
Sales ( Čcr )
OPM(%)
EPS (Č)
PER(x)
P/BV(x)
RoE(%)
EV/Sales(x)
(Č)
Price ( Č)
( Č cr )
FY17E
FY18E
FY17E
FY18E
FY17E
FY18E
FY17E
FY18E
FY17E
FY18E
FY17E
FY18E
FY17E
FY18E
Capital Goods
Voltas
Buy
302
407
9,983
6,511
7,514
7.9
8.7
12.9
16.3
23.4
18.5
4.2
3.7
16.7
18.5
1.3
1.1
BGR Energy
Neutral
107
-
773
16,567
33,848
6.0
5.6
7.8
5.9
13.7
18.2
0.8
0.8
4.7
4.2
0.1
0.1
BHEL
Neutral
125
-
30,473
28,797
34,742
-
2.8
2.3
6.9
54.1
18.0
0.9
0.9
1.3
4.8
0.7
0.5
Blue Star
Buy
464
634
4,423
4,283
5,077
5.9
7.3
14.9
22.1
31.2
21.0
6.1
5.1
20.4
26.4
1.1
0.9
Crompton Greaves
Neutral
72
-
4,519
5,777
6,120
5.9
7.0
3.3
4.5
21.9
16.0
1.0
0.9
4.4
5.9
0.7
0.6
Greaves Cotton
Neutral
122
-
2,978
1,755
1,881
16.8
16.9
7.8
8.5
15.6
14.4
3.1
2.9
20.6
20.9
1.4
1.3
Inox Wind
Neutral
178
-
3,959
5,605
6,267
15.7
16.4
24.8
30.0
7.2
6.0
2.0
1.5
25.9
24.4
0.7
0.6
KEC International
Neutral
136
-
3,490
9,294
10,186
7.9
8.1
9.9
11.9
13.7
11.4
2.0
1.7
15.6
16.3
0.6
0.6
Thermax
Neutral
847
-
10,093
5,421
5,940
7.3
7.3
25.7
30.2
33.0
28.1
4.0
3.6
12.2
13.1
1.7
1.6
VATech Wabag
Buy
470
681
2,562
3,136
3,845
8.9
9.1
26.0
35.9
18.1
13.1
2.3
1.9
13.4
15.9
0.7
0.6
Cement
ACC
Neutral
1,292
-
24,264
11,225
13,172
13.2
16.9
44.5
75.5
29.0
17.1
2.8
2.5
11.2
14.2
2.2
1.8
Ambuja Cements
Neutral
196
-
38,829
9,350
10,979
18.2
22.5
5.8
9.5
33.7
20.6
2.8
2.5
10.2
12.5
4.2
3.5
India Cements
Neutral
114
-
3,511
4,364
4,997
18.5
19.2
7.9
11.3
14.5
10.1
1.0
1.0
8.0
8.5
1.6
1.4
JK Cement
Neutral
648
-
4,533
4,398
5,173
15.5
17.5
31.2
55.5
20.8
11.7
2.5
2.2
12.0
15.5
1.6
1.3
J K Lakshmi Cement
Buy
347
565
4,084
2,913
3,412
14.5
19.5
7.5
22.5
46.3
15.4
2.8
2.4
12.5
18.0
2.0
1.7
Orient Cement
Buy
132
215
2,700
2,114
2,558
18.5
20.5
8.1
11.3
16.3
11.7
2.4
2.0
9.0
14.0
1.9
1.5
UltraTech Cement
Neutral
3,424
-
93,980
25,768
30,385
21.0
23.5
111.0
160.0
30.9
21.4
3.9
3.4
13.5
15.8
3.7
3.1
Construction
ITNL
Neutral
90
-
2,944
8,946
10,017
31.0
31.6
8.1
9.1
11.1
9.8
0.4
0.4
4.2
5.0
3.7
3.4
KNR Constructions
Accumulate
707
802
1,988
1,385
1,673
14.7
14.0
41.2
48.5
17.2
14.6
3.2
2.8
14.9
15.2
1.5
1.3
Larsen & Toubro
Buy
1,329
1,700
123,883
67,665
77,249
10.7
11.5
57.3
71.2
23.2
18.7
2.1
2.0
12.6
14.3
2.0
1.7
Gujarat Pipavav Port
Neutral
139
-
6,722
705
788
52.2
51.7
5.0
5.6
27.8
24.8
2.7
2.5
11.2
11.2
9.2
7.7
Nagarjuna Const.
Neutral
75
-
4,175
8,842
9,775
9.1
8.8
5.3
6.4
14.2
11.7
1.1
1.0
8.2
9.1
0.6
0.5
PNC Infratech
Buy
111
143
2,858
2,350
2,904
13.1
13.2
9.0
8.8
12.4
12.7
0.5
0.4
15.9
13.9
1.3
1.1
Simplex Infra
Neutral
294
-
1,453
6,829
7,954
10.5
10.5
31.4
37.4
9.4
7.9
1.0
0.9
9.9
13.4
0.6
0.5
Power Mech Projects
Neutral
435
-
640
1,801
2,219
12.7
14.6
72.1
113.9
6.0
3.8
1.1
0.9
16.8
11.9
0.4
0.3
Sadbhav Engineering
Accumulate
283
298
4,853
3,598
4,140
10.3
10.6
9.0
11.9
31.4
23.8
3.3
2.9
9.9
11.9
1.6
1.4
NBCC
Neutral
212
-
12,708
7,428
9,549
7.9
8.6
8.2
11.0
25.8
19.3
1.3
1.0
28.2
28.7
1.4
1.0
MEP Infra
Neutral
36
-
584
1,877
1,943
30.6
29.8
3.0
4.2
12.0
8.6
5.8
3.9
0.6
0.6
1.7
1.5
SIPL
Neutral
84
-
2,955
1,036
1,252
65.5
66.2
(8.4)
(5.6)
3.1
3.6
(22.8)
(15.9)
11.1
9.2
Stock Watch
November 23, 2016
Company Name
Reco
CMP
Target
Mkt Cap
Sales ( Čcr )
OPM(%)
EPS (Č)
PER(x)
P/BV(x)
RoE(%)
EV/Sales(x)
(Č)
Price ( Č)
( Č cr )
FY17E
FY18E
FY17E
FY18E
FY17E
FY18E
FY17E
FY18E
FY17E
FY18E
FY17E
FY18E
FY17E
FY18E
Construction
Engineers India
Neutral
275
-
9,261
1,725
1,935
16.0
19.1
11.4
13.9
24.1
19.8
3.3
3.2
13.4
15.3
4.3
3.8
Financials
Axis Bank
Buy
471
630
112,488
46,932
53,575
3.5
3.4
32.4
44.6
14.6
10.6
1.9
1.6
13.6
16.5
-
-
Bank of Baroda
Neutral
163
-
37,604
19,980
23,178
1.8
1.8
11.5
17.3
14.2
9.4
1.6
1.3
8.3
10.1
-
-
Canara Bank
Neutral
303
-
16,461
15,225
16,836
1.8
1.8
14.5
28.0
20.9
10.8
1.4
1.2
5.8
8.5
-
-
Dewan Housing Finance Buy
227
350
7,110
2,225
2,688
2.9
2.9
29.7
34.6
7.7
6.6
1.2
1.1
16.1
16.8
-
-
Equitas Holdings
Buy
150
235
5,019
939
1,281
11.7
11.5
5.8
8.2
25.8
18.3
2.2
2.0
10.9
11.5
-
-
Federal Bank
Neutral
70
-
11,941
9,353
10,623
2.9
2.9
4.4
5.8
15.8
12.0
1.5
1.3
9.5
11.0
-
-
HDFC
Neutral
1,247
-
197,217
11,475
13,450
3.4
3.4
45.3
52.5
27.5
23.8
5.3
4.7
20.2
20.5
-
-
HDFC Bank
Accumulate
1,197
1,350
303,125
46,097
55,433
4.5
4.5
58.4
68.0
20.5
17.6
3.6
3.0
18.8
18.6
-
-
ICICI Bank
Buy
263
315
153,248
42,800
44,686
3.1
3.3
18.0
21.9
14.6
12.0
2.0
1.8
11.1
12.3
-
-
LIC Housing Finance
Buy
517
630
26,099
3,712
4,293
2.6
2.5
39.0
46.0
13.3
11.2
2.5
2.1
19.9
20.1
-
-
Punjab Natl.Bank
Neutral
137
-
29,249
23,532
23,595
2.3
2.4
6.8
12.6
20.2
10.9
3.1
2.2
3.3
6.5
-
-
RBL Bank
Neutral
344
-
12,729
1,783
2,309
2.6
2.6
12.7
16.4
27.1
21.0
3.0
2.6
12.8
13.3
-
-
South Ind.Bank
Neutral
20
-
2,761
6,435
7,578
2.5
2.5
2.7
3.1
7.6
6.6
1.0
0.8
10.1
11.2
-
-
St Bk of India
Neutral
257
-
199,814
88,650
98,335
2.6
2.6
13.5
18.8
19.1
13.7
1.8
1.6
7.0
8.5
-
-
Union Bank
Neutral
150
-
10,339
13,450
14,925
2.3
2.3
25.5
34.5
5.9
4.4
0.9
0.7
7.5
10.2
-
-
Yes Bank
Neutral
1,132
-
47,644
8,978
11,281
3.3
3.4
74.0
90.0
15.3
12.6
2.9
2.5
17.0
17.2
-
-
FMCG
Asian Paints
Neutral
907
-
87,033
17,128
18,978
16.8
16.4
19.1
20.7
47.5
43.8
16.5
15.6
34.8
35.5
5.0
4.5
Britannia
Buy
2,904
3,626
34,846
9,594
11,011
14.6
14.9
80.3
94.0
36.2
30.9
14.9
11.5
41.2
-
3.5
3.0
Colgate
Accumulate
904
995
24,597
4,605
5,149
23.4
23.4
23.8
26.9
38.0
33.6
21.0
16.4
64.8
66.8
5.3
4.7
Dabur India
Accumulate
276
304
48,500
8,315
9,405
19.8
20.7
8.1
9.2
34.0
30.0
9.5
7.9
31.6
31.0
5.5
4.8
GlaxoSmith Con*
Neutral
5,061
-
21,284
4,350
4,823
21.2
21.4
179.2
196.5
28.2
25.8
7.5
6.4
27.1
26.8
4.3
3.8
Godrej Consumer
Neutral
1,423
-
48,443
10,235
11,428
18.4
18.6
41.1
44.2
34.6
32.2
7.7
6.5
24.9
24.8
4.8
4.3
HUL
Neutral
820
-
177,425
35,252
38,495
17.8
17.8
20.7
22.4
39.7
36.6
37.9
32.6
95.6
88.9
4.9
4.5
ITC
Buy
226
284
273,042
40,059
44,439
38.3
39.2
9.0
10.1
25.2
22.3
7.0
6.1
27.8
27.5
6.3
5.7
Marico
Buy
252
300
32,564
6,430
7,349
18.8
19.5
6.4
7.7
39.4
32.8
11.9
10.0
33.2
32.5
4.9
4.2
Nestle*
Neutral
5,893
-
56,817
10,073
11,807
20.7
21.5
124.8
154.2
47.2
38.2
19.4
17.4
34.8
36.7
5.5
4.6
Tata Global
Neutral
117
-
7,403
8,675
9,088
9.8
9.8
7.4
8.2
15.9
14.3
1.8
1.7
7.9
8.1
0.8
0.7
Procter & Gamble
Accumulate
6,563
7,369
21,304
2,939
3,342
23.2
23.0
146.2
163.7
44.9
40.1
100.5
96.4
25.3
23.5
6.8
5.9
Hygiene
Stock Watch
November 23, 2016
Company Name
Reco
CMP
Target
Mkt Cap
Sales ( Čcr )
OPM(%)
EPS (Č)
PER(x)
P/BV(x)
RoE(%)
EV/Sales(x)
(Č)
Price ( Č)
( Č cr )
FY17E FY18E
FY17E
FY18E
FY17E
FY18E
FY17E
FY18E
FY17E
FY18E
FY17E
FY18E
FY17E
FY18E
IT
HCL Tech^
Buy
761
1,000
107,344
49,242
57,168
20.5
20.5
55.7
64.1
13.7
11.9
2.8
2.1
20.3
17.9
2.0
1.6
Infosys
Buy
914
1,249
209,929
68,350
77,326
27.0
27.0
62.5
69.4
14.6
13.2
3.1
2.9
21.3
21.6
2.5
2.2
TCS
Buy
2,134
2,620
420,548
119,025
133,308
27.6
27.6
131.2
145.5
16.3
14.7
5.3
4.9
32.4
33.1
3.3
2.9
Tech Mahindra
Buy
453
600
43,968
29,673
32,937
15.5
17.0
32.8
39.9
13.8
11.4
2.7
2.4
19.6
20.7
1.2
1.0
Wipro
Buy
450
590
109,358
55,440
60,430
18.1
18.1
35.9
39.9
12.5
11.3
2.2
2.1
19.0
19.3
1.7
1.5
Media
D B Corp
Neutral
368
-
6,765
2,297
2,590
27.4
28.2
21.0
23.4
17.5
15.7
4.1
3.5
23.7
23.1
2.7
2.4
HT Media
Neutral
72
-
1,682
2,693
2,991
12.6
12.9
7.9
9.0
9.2
8.0
0.8
0.7
7.8
8.3
0.2
0.1
Jagran Prakashan
Buy
170
225
5,556
2,355
2,635
28.0
28.0
10.8
12.5
15.7
13.6
3.4
3.0
21.7
21.7
2.4
2.1
Sun TV Network
Neutral
452
-
17,807
2,850
3,265
70.1
71.0
26.2
30.4
17.3
14.9
4.4
3.9
24.3
25.6
5.8
5.0
Hindustan Media
Neutral
270
-
1,982
1,016
1,138
24.3
25.2
27.3
30.1
9.9
9.0
1.9
1.7
16.2
15.8
1.3
1.1
Ventures
TV Today Network
Buy
301
385
1,797
637
743
27.5
27.5
18.4
21.4
16.4
14.1
2.9
2.4
17.4
17.2
2.4
2.0
Metals & Mining
Coal India
Neutral
304
-
191,702
84,638
94,297
21.4
22.3
24.5
27.1
12.4
11.2
5.2
4.9
42.6
46.0
1.8
1.6
Hind. Zinc
Neutral
252
-
106,563
14,252
18,465
55.9
48.3
15.8
21.5
16.0
11.7
2.6
2.3
17.0
20.7
7.5
5.8
Hindalco
Neutral
167
-
34,413
107,899
112,095
7.4
8.2
9.2
13.0
18.1
12.8
0.9
0.8
4.8
6.6
0.8
0.8
JSW Steel
Neutral
1,638
-
39,596
53,201
58,779
16.1
16.2
130.6
153.7
12.5
10.7
1.7
1.5
14.0
14.4
1.5
1.3
NMDC
Neutral
114
-
36,053
6,643
7,284
44.4
47.7
7.1
7.7
16.1
14.8
1.4
1.4
8.8
9.2
3.2
2.9
SAIL
Neutral
48
-
19,804
47,528
53,738
(0.7)
2.1
(1.9)
2.6
18.4
0.5
0.5
(1.6)
3.9
1.3
1.2
Vedanta
Neutral
207
-
61,340
71,744
81,944
19.2
21.7
13.4
20.1
15.4
10.3
1.3
1.2
8.4
11.3
1.2
1.0
Tata Steel
Neutral
378
-
36,712
121,374
121,856
7.2
8.4
18.6
34.3
20.3
11.0
1.3
1.2
6.1
10.1
0.9
0.9
Oil & Gas
Cairn India
Neutral
231
-
43,356
9,127
10,632
4.3
20.6
8.8
11.7
26.3
19.8
0.8
0.8
3.3
4.2
6.2
5.2
GAIL
Neutral
415
-
52,629
56,220
65,198
9.3
10.1
27.1
33.3
15.3
12.5
1.4
1.3
9.3
10.7
1.1
0.9
ONGC
Neutral
278
-
237,800
137,222
152,563
15.0
21.8
19.5
24.1
14.3
11.5
1.2
1.2
8.5
10.1
2.0
1.8
Indian Oil Corp
Neutral
297
-
143,978
373,359
428,656
5.9
5.5
54.0
59.3
5.5
5.0
0.9
0.8
16.0
15.6
0.5
0.5
Reliance Industries
Neutral
1,001
-
324,601
301,963
358,039
12.1
12.6
87.7
101.7
11.4
9.8
1.2
1.1
10.7
11.3
1.6
1.3
Pharmaceuticals
Alembic Pharma
Neutral
632
-
11,922
3,483
4,083
20.2
21.4
24.3
30.4
26.0
20.8
5.9
4.7
25.5
25.3
3.4
2.8
Aurobindo Pharma
Buy
719
877
42,062
15,720
18,078
23.7
23.7
41.4
47.3
17.4
15.2
4.5
3.5
29.6
26.1
2.9
2.5
Sanofi India*
Neutral
4,138
-
9,531
2,277
2,597
17.3
18.3
149.4
172.0
27.7
24.1
4.6
3.7
25.1
28.8
3.9
3.1
Cadila Healthcare
Accumulate
371
400
37,981
10,429
12,318
22.6
22.0
16.9
19.2
22.0
19.3
5.6
4.5
28.5
25.7
3.6
3.0
Cipla
Reduce
550
490
44,176
15,378
18,089
17.4
18.4
21.6
27.2
25.5
20.2
3.3
2.9
13.7
15.2
3.1
2.6
Stock Watch
November 23, 2016
Company Name
Reco
CMP
Target
Mkt Cap
Sales ( Čcr )
OPM(%)
EPS (Č)
PER(x)
P/BV(x)
RoE(%)
EV/Sales(x)
(Č)
Price ( Č)
( Č cr )
FY17E FY18E
FY17E
FY18E
FY17E
FY18E
FY17E
FY18E
FY17E
FY18E
FY17E
FY18E
FY17E
FY18E
Pharmaceuticals
Dr Reddy's
Neutral
3,121
-
51,709
16,043
18,119
20.8
22.4
112.4
142.9
27.8
21.8
3.7
3.3
14.1
15.9
3.2
2.8
Dishman Pharma
Neutral
231
-
3,735
1,718
1,890
22.7
22.8
9.5
11.3
24.4
20.5
2.4
2.1
10.1
10.9
2.6
2.3
GSK Pharma*
Neutral
2,620
-
22,188
3,000
3,312
15.4
20.6
46.5
60.8
56.3
43.1
13.5
13.5
26.3
30.6
7.1
6.5
Indoco Remedies
Reduce
275
240
2,531
1,112
1,289
16.2
18.2
11.6
16.0
23.7
17.2
3.8
3.2
17.0
20.1
2.4
2.0
Ipca labs
Accumulate
545
613
6,873
3,303
3,799
15.3
15.3
17.3
19.7
31.5
27.7
2.7
2.5
9.1
9.4
2.2
1.9
Lupin
Buy
1,413
1,809
63,724
15,912
18,644
26.4
26.7
58.1
69.3
24.3
20.4
4.7
3.9
21.4
20.9
4.1
3.4
Sun Pharma
Buy
690
847
166,002
31,129
35,258
32.0
32.9
30.2
35.3
22.8
19.5
3.7
3.1
20.0
20.1
4.9
4.1
Power
Tata Power
Neutral
69
-
18,648
36,916
39,557
17.4
27.1
5.1
6.3
13.5
10.9
1.2
1.1
9.0
10.3
1.5
1.4
NTPC
Neutral
154
-
127,145
86,605
95,545
17.5
20.8
11.8
13.4
13.1
11.5
1.3
1.2
10.5
11.1
2.8
2.8
Power Grid
Neutral
184
-
96,314
25,763
29,762
74.3
73.1
14.8
17.3
12.4
10.6
1.9
1.7
16.9
17.5
8.0
7.6
Real Estate
MLIFE
Buy
353
522
1,448
1,152
1,300
22.7
24.6
29.9
35.8
11.8
9.9
0.9
0.8
7.6
8.6
2.0
1.6
Telecom
Bharti Airtel
Neutral
304
-
121,541
105,086
114,808
34.5
34.7
12.2
16.4
24.9
18.5
1.7
1.6
6.8
8.4
2.1
1.8
Idea Cellular
Neutral
71
-
25,692
40,133
43,731
37.2
37.1
6.4
6.5
11.2
11.0
0.9
0.9
8.2
7.6
1.7
1.4
zOthers
Abbott India
Neutral
4,621
-
9,818
3,153
3,583
14.1
14.4
152.2
182.7
30.4
25.3
149.1
127.3
25.6
26.1
2.8
2.4
Bajaj Electricals
Buy
206
274
2,085
4,801
5,351
5.7
6.2
10.4
13.7
19.8
15.1
2.5
2.2
12.4
14.5
0.4
0.4
Finolex Cables
Neutral
388
-
5,933
2,883
3,115
12.0
12.1
14.2
18.6
27.3
20.9
14.5
12.7
15.8
14.6
1.8
1.6
Goodyear India*
Neutral
683
-
1,575
1,598
1,704
10.4
10.2
49.4
52.6
13.8
13.0
63.8
56.0
18.2
17.0
0.7
92.5
Hitachi
Neutral
1,375
-
3,738
2,081
2,433
8.8
8.9
33.4
39.9
41.2
34.5
33.2
27.7
22.1
21.4
1.8
1.5
Jyothy Laboratories
Neutral
337
-
6,125
1,440
2,052
11.5
13.0
8.5
10.0
39.7
33.7
9.6
8.9
18.6
19.3
4.5
3.2
Page Industries
Neutral
12,741
-
14,211
2,450
3,124
20.1
17.6
299.0
310.0
42.6
41.1
283.8
216.6
47.1
87.5
5.9
4.6
Relaxo Footwears
Neutral
395
-
4,744
2,085
2,469
9.2
8.2
7.6
8.0
52.3
49.7
20.3
17.3
17.9
18.8
2.4
2.0
Siyaram Silk Mills
Accumulate
1,213
1,714
1,137
1,799
2,040
11.6
11.7
104.9
122.4
11.6
9.9
1.9
1.6
16.4
16.4
0.8
0.7
Styrolution ABS India*
Neutral
573
-
1,007
1,440
1,537
9.2
9.0
40.6
42.6
14.1
13.4
36.0
32.8
12.3
11.6
0.7
0.6
TVS Srichakra
Neutral
3,122
-
2,390
2,304
2,614
13.7
13.8
231.1
266.6
13.5
11.7
350.8
276.2
33.9
29.3
1.0
0.9
HSIL
Neutral
294
-
2,122
2,384
2,515
15.8
16.3
15.3
19.4
19.2
15.1
19.1
16.4
7.8
9.3
1.1
1.0
Kirloskar Engines India
Neutral
319
-
4,617
2,554
2,800
9.9
10.0
10.5
12.1
30.4
26.4
12.7
12.0
10.7
11.7
1.4
1.3
Ltd
M M Forgings
Neutral
419
-
506
546
608
20.4
20.7
41.3
48.7
10.2
8.6
57.5
50.9
16.6
17.0
0.8
0.7
Banco Products (India)
Neutral
167
-
1,192
1,353
1,471
12.3
12.4
14.5
16.3
11.5
10.2
15.9
14.3
14.5
14.6
0.8
87.5
Competent Automobiles Neutral
151
-
93
1,137
1,256
3.1
2.7
28.0
23.6
5.4
6.4
29.0
26.2
14.3
11.5
0.1
0.1
Stock Watch
November 23, 2016
Company Name
Reco
CMP
Target
Mkt Cap
Sales ( Čcr )
OPM(%)
EPS (Č)
PER(x)
P/BV(x)
RoE(%)
EV/Sales(x)
(Č)
Price ( Č)
( Č cr )
FY17E
FY18E
FY17E
FY18E
FY17E
FY18E
FY17E
FY18E
FY17E
FY18E
FY17E
FY18E
FY17E
FY18E
zOthers
Nilkamal
Neutral
1,243
-
1,855
1,995
2,165
10.7
10.4
69.8
80.6
17.8
15.4
71.0
61.7
16.6
16.5
0.9
0.8
Visaka Industries
Neutral
178
-
283
1,051
1,138
10.3
10.4
21.0
23.1
8.5
7.7
22.8
21.4
9.0
9.2
0.5
0.5
Transport Corporation of
Neutral
164
-
1,257
2,671
2,911
8.5
8.8
13.9
15.7
11.8
10.5
1.6
1.4
13.7
13.8
0.6
0.5
India
Elecon Engineering
Neutral
46
-
497
1,482
1,660
13.7
14.5
3.9
5.8
11.7
7.9
2.8
2.5
7.8
10.9
0.7
0.6
Surya Roshni
Neutral
188
-
822
3,342
3,625
7.8
7.5
17.3
19.8
10.9
9.5
20.6
16.6
10.5
10.8
0.5
0.5
MT Educare
Neutral
107
-
426
366
417
17.7
18.2
9.4
10.8
11.4
9.9
2.5
2.2
22.2
22.3
1.1
0.9
Radico Khaitan
Buy
118
147
1,575
1,667
1,824
13.0
13.2
6.7
8.2
17.8
14.5
1.6
1.5
9.0
10.2
1.3
1.2
Garware Wall Ropes
Accumulate
567
600
1,241
873
938
14.3
14.3
35.2
37.5
16.1
15.1
2.8
2.4
17.5
15.9
1.3
1.2
Wonderla Holidays
Neutral
324
-
1,831
287
355
38.0
40.0
11.3
14.2
28.7
22.8
4.1
3.6
21.4
23.9
6.1
4.9
Linc Pen & Plastics
Neutral
228
-
337
382
420
9.3
9.5
13.5
15.7
16.9
14.5
2.9
2.5
17.1
17.3
0.9
0.8
The Byke Hospitality
Neutral
171
-
686
287
384
20.5
20.5
7.6
10.7
22.5
16.0
4.7
3.8
20.7
23.5
2.4
1.8
Interglobe Aviation
Neutral
859
-
30,944
21,122
26,005
14.5
27.6
110.7
132.1
7.8
6.5
46.4
33.2
168.5
201.1
1.4
1.1
Coffee Day Enterprises
Neutral
200
-
4,126
2,964
3,260
20.5
21.2
4.7
8.0
-
25.0
2.3
2.1
5.5
8.5
1.8
1.6
Ltd
Navneet Education
Neutral
106
-
2,519
1,062
1,147
24.0
24.0
6.1
6.6
17.4
16.0
3.6
3.2
20.6
19.8
2.5
2.3
Navkar Corporation
Buy
172
265
2,453
408
612
42.9
42.3
6.8
11.5
25.4
15.0
1.8
1.6
6.9
10.5
6.9
4.6
UFO Moviez
Neutral
416
-
1,149
619
685
33.2
33.4
30.0
34.9
13.9
11.9
1.9
1.7
13.8
13.9
1.6
1.2
VRL Logistics
Neutral
262
-
2,391
1,902
2,119
16.7
16.6
14.6
16.8
18.0
15.6
3.9
3.5
21.9
22.2
1.4
1.2
Team Lease Serv.
Neutral
849
-
1,452
3,229
4,001
1.5
1.8
22.8
32.8
37.3
25.9
4.0
3.5
10.7
13.4
0.4
0.3
S H Kelkar & Co.
Neutral
284
-
4,105
1,036
1,160
15.1
15.0
6.1
7.2
46.5
39.5
5.0
4.6
10.7
11.5
3.8
3.4
Quick Heal
Neutral
226
-
1,583
408
495
27.3
27.0
7.7
8.8
29.2
25.7
2.7
2.7
9.3
10.6
3.0
2.5
Narayana Hrudaya
Neutral
341
-
6,967
1,873
2,166
11.5
11.7
2.6
4.0
128.9
86.0
7.9
7.1
6.1
8.3
3.8
3.3
Manpasand Bever.
Neutral
615
-
3,517
836
1,087
19.6
19.4
16.9
23.8
36.4
25.8
4.4
3.8
12.0
14.8
3.9
3.0
Parag Milk Foods
Neutral
262
-
2,204
1,919
2,231
9.3
9.6
9.5
12.9
27.7
20.3
4.3
3.6
15.5
17.5
1.3
1.1
Mirza International
Buy
70
107
845
987
1,106
18.0
18.0
6.5
7.6
10.8
9.2
1.7
1.5
15.9
15.7
1.1
0.9
Asian Granito
Buy
180
351
541
1,071
1,182
12.1
12.4
12.7
16.0
14.1
11.3
1.4
1.2
9.5
10.7
0.8
0.7
Source: Company, Angel Research; Note: *December year end; #September year end; &October year end; Price as on November 22, 2016
Market Outlook
November 23, 2016
Research Team Tel: 022 - 39357800
DISCLAIMER
Angel Broking Private Limited (hereinafter referred to as “Angel”) is a registered Member of National Stock Exchange of India
Limited,Bombay Stock Exchange Limited and Metropolitan Stock Exchange Limited. It is also registered as a Depository Participant with
CDSL and Portfolio Manager with SEBI. It also has registration with AMFI as a Mutual Fund Distributor. Angel Broking Private Limited is a
registered entity with SEBI for Research Analyst in terms of SEBI (Research Analyst) Regulations, 2014 vide registration number
INH000000164. Angel or its associates has not been debarred/ suspended by SEBI or any other regulatory authority for accessing
/dealing in securities Market. Angel or its associates/analyst has not received any compensation / managed or
co-managed public offering of securities of the company covered by Analyst during the past twelve months.
This document is solely for the personal information of the recipient, and must not be singularly used as the basis of any investment
decision. Nothing in this document should be construed as investment or financial advice. Each recipient of this document should make
such investigations as they deem necessary to arrive at an independent evaluation of an investment in the securities of the companies
referred to in this document (including the merits and risks involved), and should consult their own advisors to determine the merits and
risks of such an investment.
Reports based on technical and derivative analysis center on studying charts of a stock's price movement, outstanding positions and
trading volume, as opposed to focusing on a company's fundamentals and, as such, may not match with a report on a company's
fundamentals. Investors are advised to refer the Fundamental and Technical Research Reports available on our website to evaluate the
contrary view, if any.
The information in this document has been printed on the basis of publicly available information, internal data and other reliable
sources believed to be true, but we do not represent that it is accurate or complete and it should not be relied on as such, as this
document is for general guidance only. Angel Broking Pvt. Limited or any of its affiliates/ group companies shall not be in any way
responsible for any loss or damage that may arise to any person from any inadvertent error in the information contained in this report.
Angel Broking Pvt. Limited has not independently verified all the information contained within this document. Accordingly, we cannot
testify, nor make any representation or warranty, express or implied, to the accuracy, contents or data contained within this document.
While Angel Broking Pvt. Limited endeavors to update on a reasonable basis the information discussed in this material, there may be
regulatory, compliance, or other reasons that prevent us from doing so.
This document is being supplied to you solely for your information, and its contents, information or data may not be reproduced,
redistributed or passed on, directly or indirectly.
Neither Angel Broking Pvt. Limited, nor its directors, employees or affiliates shall be liable for any loss or damage that may arise from
or in connection with the use of this information.